
The sea level has risen over the past few years and we are seeing it now.
Climate change and long cyclical weather patterns have conspired to raise sea levels at unprecedented rates over the past dozen years along the Gulf Coast and parts of the East Coast, according to two recent scientific papers. The sea rise in those areas has reached a rate greater than 10 millimeters a year — or about four-tenths of an inch — according to the research. That places rising seas along the Gulf at the top edge of estimates that state officials have been using to inform their plans to address coastal erosion and storm-surge flooding over the next decade. “That’s approximately five times the amount of sea level rise that we have seen on average on that part of the U.S. coastline over the 20th century,” said Sönke Dangendorf, lead author of one of the studies and an assistant professor in Tulane University’s Department of River-Coastal Science and Engineering. Dangendorf said the sea rise in those areas also was nearly three times as fast as the global average during the same period.
nola.com
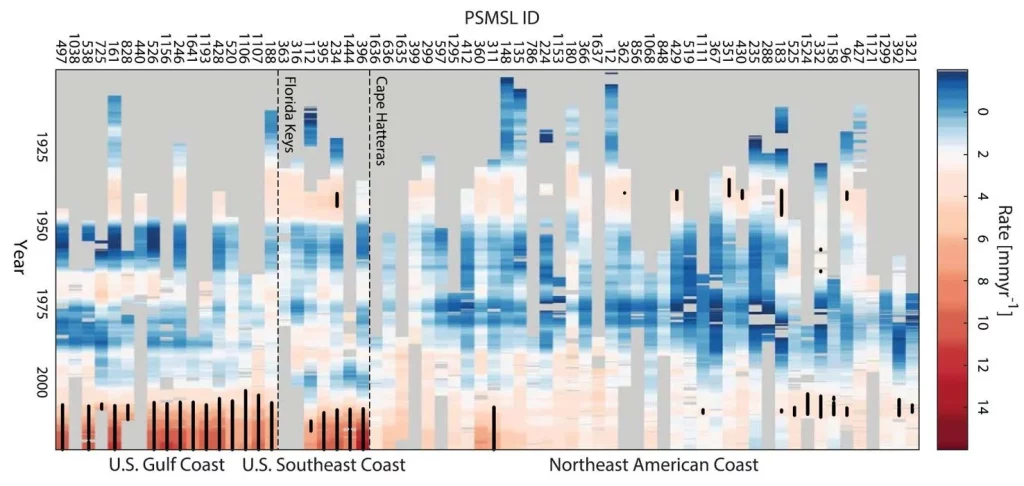
Rates of mean sea level rise along the North American East andGulf Coasts since 1900. Color shadings represent the rates of sea level rise, corrected for subsidence and other vertical land motions, with tide gauges arranged from Texas, left, to Newfoundland, right, following the coastline. Rates that represent a significant acceleration from the mean rate are marked with black dots. The two dashed lines mark Cape Hatteras
and the Florida Keys.
(Sönke Dangendorf, Nature Communications)
We are not alone as other ares are seeing the same.
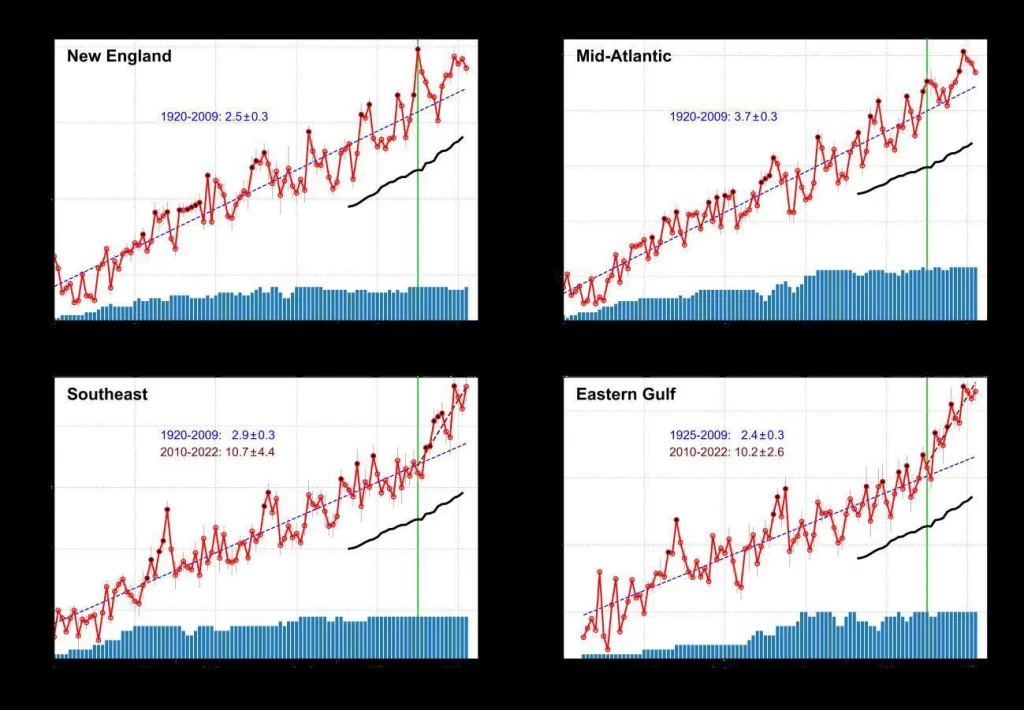
The alarming study, published Monday in Nature Communications, analyzed tide gauge records along the east and Gulf coasts from Canada to Mexico to identify areas with fast-rising seas. It was co-authored by researchers at Tulane, Old Dominion University, the California Institute of Technology, the U.K.’s National Oceanography Centre and the University of Central Florida. A second paper, authored by University of Arizona climate sciences Professor Jianjun Yin, delivered a similar message about the historic pace of sea-level rise along the Gulf Coast and elsewhere.Reviewing tide gauge data over 90 years ending in 2009, Yin found that seas rose largely in a straight line up to then — at rates of 2.5 mm a year along the New England coast, 3.7 mm along the Mid-Atlantic coast, 2.9 mm along the Southeast coast, and 2.4 mm in the eastern Gulf of Mexico. But since 2010, the increase in sea levels accelerated. The rates rose to 10.7 mm a year on the Southeast coast, and 10.2mm a year on the eastern Gulf Coast, Yin said in a study published on March 3 in the American Meteorological Society’s Journal of Climate.
(NOAA)

(NOAA)
There are factors other than global warming, for instance we are sinking.
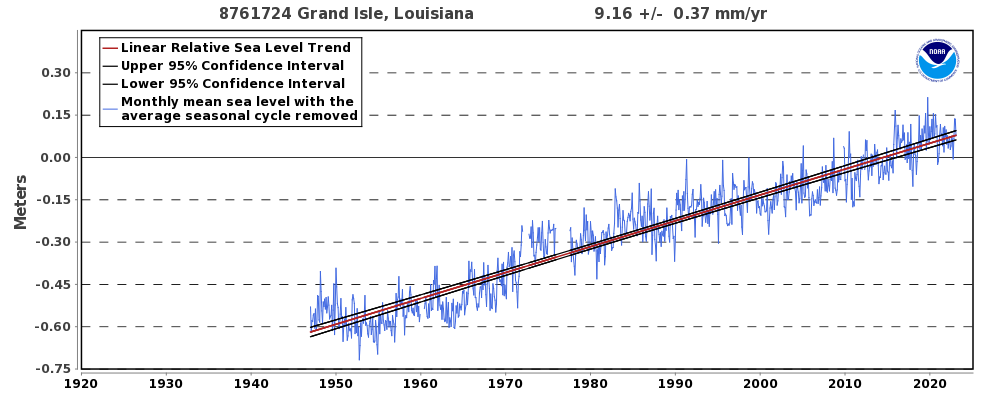
Both studies said that factors other than human-caused global warming contributed to the short-term acceleration in sea-level rise. And while the two papers found slightly different reasons for the rise, they pointed to the same disturbing effects: More frequent nuisance flooding in coastal communities like Miami and Grand Isle; Increased damages that higher surge levels have caused during recent storms and hurricanes; More frequent hurricanes due to warmer water associated with sea level rise; and Increased rates of land loss in vulnerable areas like Louisiana’s coastline. “These examples illustrate that any further increases in the rate of (sea level) rise, particularly rapid ones, threaten the national security of the U.S. and hamper timely adaptation measures,” Dangendorf said.

(Chris Franks, National Weather Service)
The same reasons for the fast increase may lead to a slow down.
The reasons for the quick ramp-up in rising seas also offer some promise of a slowdown, he said. The researchers rejected the notion of a major contribution from melting glaciers and icepacks, describing them as a lesser cause. Instead, they found that 40% of the increasing rate of sea-level rise was attributable to climate change that warms oceans and causes water molecules to expand. Another 60% came from changes to wind or ocean current patterns over the tropical Atlantic Ocean. The result was more warmed water reaching the southern East Coast and the Gulf. “What makes it more complicated in Louisiana and Texas is the subsidence that comes on top of that, and that leads to rates of 14 to 15 millimeters a year,” Dangendorf said.

The oceans run a 40 year cycle of warm and cold water.
Part of that natural variability, he said, is a 25- to 40-year cycle linked to lower and higher water temperatures in the Atlantic, called the Atlantic Multi-Decadal Oscillation. Many climate scientists who study hurricanes believe that a warmer water version of that cycle began in 1995 and has stirred more frequent hurricanes. The bright side of that finding is that sea-rise could slow back to the pre-2010 rate of 1.5 mm a year in about a decade. Yet even that lower global rate, a mainstay since 1900, marked a significant increase in sea-level rise from the previous 3,000 years, the study found. In his study, Yin discounted nearshore winds and changes in barometric pressure along coastlines as leading causes of the increase in sea level rise.
(Jianjun Yin, Journal of Climate)
The Gulf also feeds the Gulf Stream and the Gulf of Mexico.
His research found another trend: more warm water feeding into the Gulf Stream and the Gulf of Mexico from a significant slowdown of a large, north-south oceanic pattern. Yin argues that a downshift in the Atlantic Meridional Overturning Circulation, beginning in 2009 and 2010, injected even more warmth into the deep Loop Current, a segment of the Gulf Stream that breaks off every year or so and floats around the Gulf. That bloated the size of water molecules, adding to sea level rise. Yin also linked the acceleration to the heights of hurricane-induced storm surge in recent years. He measured the surge and sea levels at local gauges from Texas to North Carolina over a half-dozen massive hurricanes: Harvey in 2017; Florence and Michael in 2018; Laura in 2020; Ida in 2021; Ian in 2022. All six were high-impact, Category 4 or 5 storms with elevated water levels that heightened the damage, ranging from $27 billion to $148 billion.

(NOAA)
Sea level rise will continue making the problems we are having now will be worse.
Yin warned that sea levels along the East and Gulf Coasts could continue to rise at the present rates, but like Dangendorf he believes sea-rise here will slow in the next decade. Both studies point out that the elevated water levels in the ocean currents — and the warm water within them — lie within areas where hurricanes form. In some cases, such as in storms in the Gulf passing over or near the Loop Current, the warmer waters have been linked to rapid intensification, where hurricanes power up by a full category or more within 12 hours.
The CPRA has used two different models.
In Louisiana, the Coastal Protection and Restoration Authority has used two different sea level rise estimates over the next 10 years for its coastal Master Plan projects that are based on United Nations and NOAA estimates of future sea level rise. The lower estimate calls for a 7 mm rise in sea level a year. The higher estimate calls for 10 mm a year, about the same rate as the two papers found exists. Stuart Brown, who heads the CPRA Master Plan program, pointed out that in the last decade of the 50-year plan, state estimates range from a rise from 13 mm to 21 mm a year.The Master Plan estimates that by 2073, and without additional construction, the state will lose 1,100 to 3,000 square miles of its coastline to fast-rising seas. If all of the projects in the 2023 update’s $50 billion plan are built, the state estimates the land loss will be cut by 314 square miles under the low sea-level rise scenario, and 233 square miles under the high scenario.
This one is the second on this same set of studies but this is more locally focused.


